Ewelme Weather
Weather Data Logging
developed using
Visual VIGO graphical SCADA
software from
PROCES-DATA

Local 5 day Forecast
(Click on map to zoom in on Ewelme)
This Weather Widget is provided by the Met Office
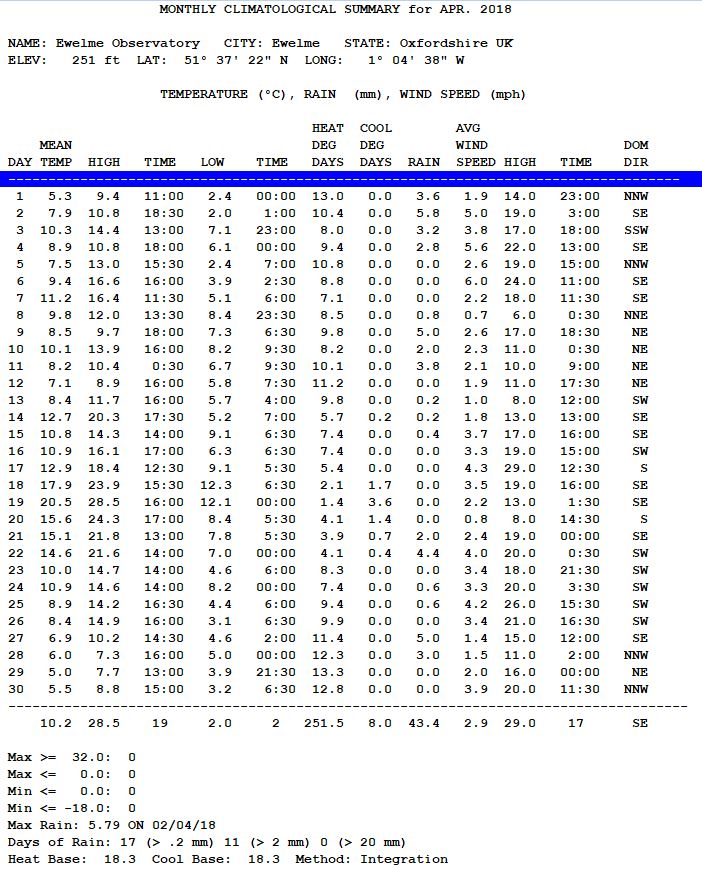
Facts about the weather charts
How much rain did we have in Ewelme last month? Did we actually have a frost last night? Over what period did we have that mini heat wave? Should I hang the washing out today?
These time based data log charts not only provide an overview of the weather situation at the specific date and time as shown in the heading (like most on-line weather stations), but also its trends and variations over a rolling 28 day period. The "current" measurements are shown in the white boxes associated with each chart. They are derived from a computer display designed using software called Visual VIGO which has been developed by the high tech Danish company that I work for . This is being constantly updated in real time with measurements from my programmed weather station computer. This chart is uploaded to the web site on a regular basis throughout each day, and although "static", is useful for seeing various measurements which have occurred at a point in time (e.g. a hot or stormy day). From time to time, a maximum or minimum data box will be seen together with a cross hair reference point indicating some exceptional high or low reading seen throughout the month.
Pressure: This is the atmospheric pressure and is usually measured using a barometer. Old barometers usually measure pressure in "inches of mercury" but the modern measurement is now millibars, where 1 bar (1000 mb) is the 'normal' average pressure at sea level. A Barograph is also an instrument for measuring atmospheric pressure in the same way as a barometer, but this time it is usually driven by clockwork so that a pen can trace the rise and fall of pressure on a piece of paper over a period of time. This is precisely what is being shown on the chart. It is the rate and direction of change in pressure that can give an indication of expected weather. This is why you tap a barometer to see whether the "glass" is rising or falling. The level can also give an indication of the current weather situation where markings such as "Stormy", "Rain", "Change", "Fair", and "Very Dry" are often seen included on the scale. Therefore this trace can show that if the pressure was falling rapidly (bad weather expected) or rising (weather improving) or is steady at a high level (good dry weather) or at a low level (continuous bad wet weather).
Rain: This trace and reading is derived from a "see-saw" rain gauge, which switches state every 0.2mm of rainfall. The level is usually reset at the beginning of a month, so that an idea of total monthly rainfall can be seen.
Temperature: This chart compares the inside and outside temperature over a period of time. Notice how the outside temperature falls around sunset and that the inside temperature falls during the night due to reduced heating. Since the inside temperature sensor is in the kitchen under a skylight, this also gives an indication of whether it was sunny around midday. During the Summer, if there is an extra "blip" during the peak, it was sunny. If not, it was cloudy or dull. During the Winter, the WIND CHILL graph will also be displayed to show how cold we actually feel..brrr! No, this isn't the black ink running, but merely related to changing wind speed.
Wind: These graphs provide a history of the state of wind speed and direction. In this hemisphere, we know that a more northerly wind is colder than a southerly one. You should be able to be see the difference in the temperature depending on the direction and speed of the wind.
Humidity: Humidity is a measure of how much water is contained in the air, and is defined as a percentage from none 0% (dry and impossible) to fully saturated 100% during thick fog or torrential rain. This chart compares the change in inside and outside humidity over a period of time. Notice how the outside humidity rises before it rains. Inside humidity is usually lower due to moisture being taken out of the air by heating and sheltered from outside influences. See what happens when we start cooking though!